Custom OCR with Machine Learning
Not every AI problem needs deep learning.

The number of posts on custom optical character recognition with machine learning is quite small at the point of writing this post. The common ones you will probably see make use of deep learning or the tesseract library. In this post, I will be explaining how to train your own custom optical character recognizer using machine learning. The method we’ll be looking at won’t require much data but performs quite wonderfully. I used this when building a prototype ALPR for Nigerian License plates. So let’s dive in.
First of all, you have to know that OCR, is just image classification like your cats vs dogs tutorial. Yes!, a multi-class image classification. However, in this scenario your folders won’t be labeled cats and dogs but A-Z and 0–9.
!!! Take care to note sometimes zeros ‘0’ may look like the letter ‘O’ , pick one or both depending on your font type.
Also, we won’t be using Keras,Tensorflow or any deep learning libraries. Instead, we would be using a popular machine learning classification algorithm we all know and love, Logistic regression.
Outline
1. Gathering and cleaning the Dataset
2. Feature extraction using Histogram of Oriented Gradients(HOG)
3. Training and testing
Gathering and cleaning the data
Like with all machine learning problems, I needed data. Data is the engine that drives artificial intelligence. As I mentioned earlier, this was used for a license plate recognition program. So, I went around town taking photographs and recording videos of cars. For the videos, I wrote a simple program to save 2 frames every second. In the end, I had quite a number of license plates to work with, however, I didn’t use all the photos since it was a prototype, but the results were impressive. There was still a lot of work to be done as most of the license plates were skewed. I had to perform perspective correction on all the images.
Again, putting my image processing skills to use, I wrote another python script with OpenCV to help me correct the perspective after selecting the four corners of the license plates. Thereafter, I thresholded the image to get the contours of the letters which were extracted and saved.

Still on the cleaning, I had about 1037 images of different letters A-Z,0–9 which again to had to be sorted into their respective folders.

Dragging and dropping was certainly not an option, so once again, python to the rescue!!. Another script was written, but this time, the program displayed the characters one after another and when a corresponding character was pressed on the keyboard it saved to the appropriate folder. Thus, if an image of letter ‘A’ is displayed and ‘A’ is pressed on the keyboard it saves it to folder ‘A’. Lastly, I still had to do visual confirmation and get rid of any mistakes. Finally, cleaning and sorting was done!
Feature extraction using Histogram of Oriented Gradients (HOG)
Now, that my data had been cleaned at least 60 percent of our job was done. I moved to extracting features from my images.
Let me introduce to you, Histogram of Oriented Gradients (HOG). HOG has been around since 2004 and it is still being used today. If you are one of the folks that skipped the foundations of image processing and jumped into deep learning, you probably won’t know what I am talking about. However, just know that it is similar to feature extraction that takes place in a convolutional neural network, so see here for more details.
Let’s see what a HOG looks like by using the code below.
import cv2
from skimage.feature import hogim_test =  cv2.imread('ocr_data/train/A/roi107644.jpg',0)
_,hog_img= hog(im_test,orientations=9,pixels_per_cell=(8,8), cells_per_block=(1, 1),visualize=True)
plt.imshow(hog_img,cmap='gray')
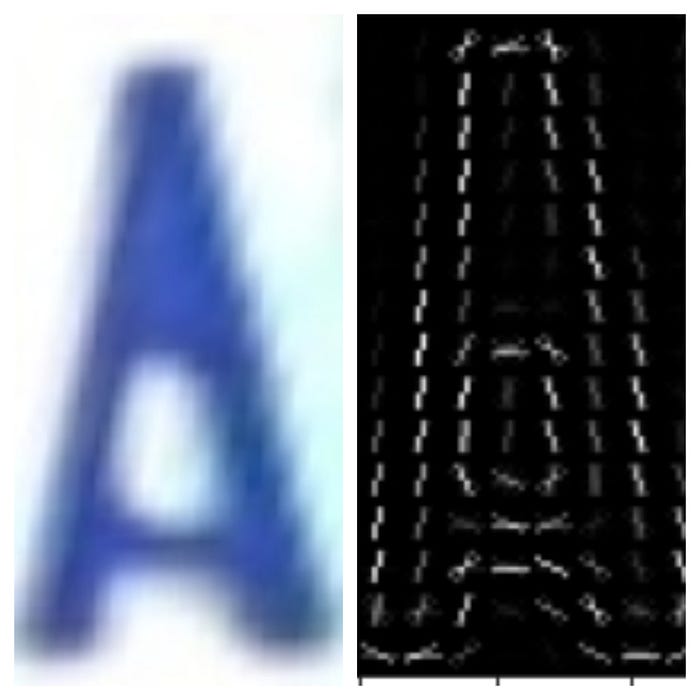
However, I used it as a one-dimensional array. The length of the array is usually determined by the parameters set to extract the HOG. For this case, mine was 1052 columns.
Training with logistic regression and testing
From here I read in each image, performed feature extraction and then stored the extracted features with their corresponding labels in a list and later converted it to a data frame.
features = []
labels = []
for i,j in enumerate(zip(pathimg,labels_list)):
  imgs,label = j
  for img in imgs:
      img = cv2.imread(train_dir+label+'/'+img)
      img_res=cv2.resize(img,(64,128),interpolation=cv2.INTER_AREA)
      img_gray= cv2.cvtColor(img_res,cv2.COLOR_BGR2GRAY)
      hog_img= hog(img_gray,orientations=9,pixels_per_cell=(8,8), cells_per_block=(1, 1))
      features.append(hog_img)
      labels.append(label)df = pd.DataFrame(np.array(features))
df['target'] = labels
df
Then I checked if the data was balanced, by using
sns.countplot(x='target', data=df)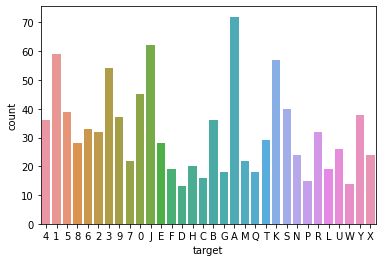
Oops, the data was very much unbalanced. We then split it up into a training and testing set, then using imblearn I balanced the data by oversampling.
Training
Here I used logistic regression to build my classifier.
x = np.array(df.iloc[:,:-1])
y = np.array(df['target'])from sklearn.linear_model import LogisticRegression
from sklearn.model_selection import train_test_split
x_train, x_test, y_train, y_test = train_test_split(x, y,
test_size=0.20,
random_state=42)from imblearn.over_sampling import SMOTE
sm = SMOTE(random_state=0)
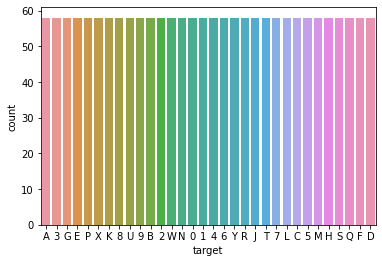
sm_x,sm_y=sm.fit_sample(x_train, y_train)bal_df = pd.DataFrame(sm_x)
bal_df['target']=pd.DataFrame(sm_y)
sns.countplot(x='target', data=bal_df)
lreg = LogisticRegression()
clf=lreg.fit(sm_x, sm_y)
y_pred = clf.predict(x_test)
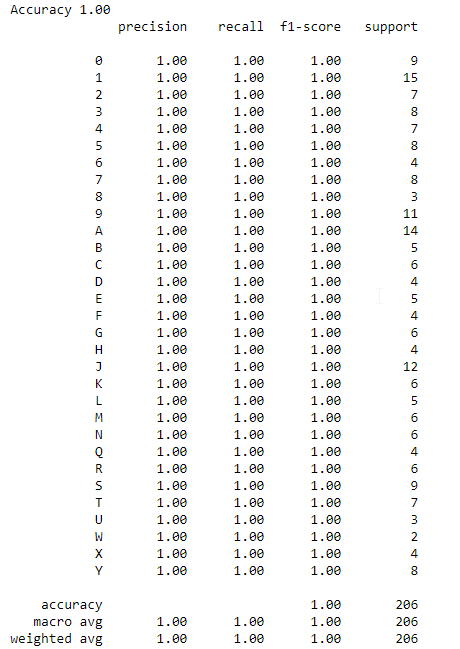
print('Accuracy {:.2f}'.format(clf.score(x_test, y_test)))
from sklearn.metrics import classification_report
print(classification_report(y_test, y_pred))Below is the result of the training.
Testing
Finally, let's put our model to use.
First, we load our classifier and read in our image.
# Load the classifier
clf = joblib.load("ocr_data/models/hog_lreg_model_3.pkl")# Read the input image
im = cv2.imread("ocr_data/licenseplates/licplate4.jpg")
Next, we convert our image to grayscale so we can threshold it, find contours and then sort it from left to right. You can look up the python ‘sorted’ inbuilt function.
# Convert to grayscale
im_gray = cv2.cvtColor(im, cv2.COLOR_BGR2GRAY)

# Threshold the image in order to find contours
ret, im_th = cv2.threshold(im_gray, 0, 255, cv2.THRESH_BINARY+cv2.THRESH_OTSU)# Find contours in the image
ctrs,hier = cv2.findContours(im_th, cv2.RETR_TREE,
                                 cv2.CHAIN_APPROX_SIMPLE)
bboxes=[cv2.boundingRect(c) for c in ctrs]
sorted_bboxes = sorted(bboxes,key=lambda b:b[0])
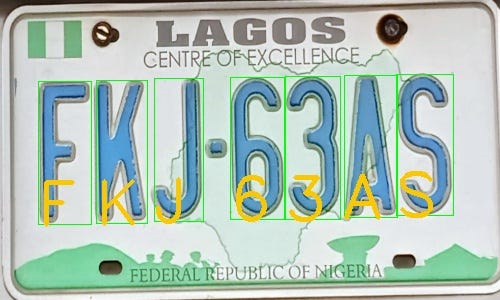
We then loop over the sorted bounding boxes with specified maximum width and height, crop the characters, resize, extract HOG features, pass them through the classifier to get the predictions and then store the result in a list.
plate_char=[]
for num,i_bboxes in enumerate(sorted_bboxes):
    [x,y,w,h]=i_bboxes
    if h>100 and w < 100:
    # Make the rectangular region around the digit
        cv2.rectangle(im,(x,y),(x+w,y+h),(0,255,0),1)
        roi=im_gray[y:y+h,x:x+w]
        # Resize the image
        roi = cv2.resize(roi, (64, 128), interpolation=cv2.INTER_AREA)
        # Calculate the HOG features
        # use the same parameters used for training
        roi_hog_fd = hog(roi, orientations=9, pixels_per_cell=(8, 8),
                         cells_per_block=(1, 1))
        cpred = clf.predict(np.array([roi_hog_fd]))

        cv2.putText(im, str((cpred[0])), (x,y+h),cv2.FONT_HERSHEY_SIMPLEX,
                    2, (0, 200, 250), 3)
        plate_char.append(str(cpred[0]))print(''.join(plate_char))cv2.imshow('result',im)
and that's it!
Link to the notebook can be found here

